DataFrameの構造や基本統計量を読む前提として、列・行の意味や作り方を理解しておくとスムーズです。まずは Pandas DataFrame入門:基本構造・作り方・Seriesとの違い【第3回】 を確認してください。
データ分析は、まず全体像(型・欠損・統計量)を把握すると迷いが減ります。
このページではinfo()/describe()の見方を出力例で整理し、include=’all’も解説します。まずは全体チェックから始めましょう。
Pythonでデータ分析を行う際には、データの全体像をつかむことが非常に重要です。その際は、Pandasライブラリのinfo()とdescribe()メソッドを活用しましょう。データフレームの構造や基本統計量を把握する方法を、具体例を用いて初心者向けにわかりやすく解説します。
この記事でわかること:info()とdescribe()で確認できる情報の違いと、実務での使い分け。
こんな人におすすめ:読み込んだDataFrameの状態確認を毎回なんとなくで済ませている方。
読み終えるとできること:型・欠損・統計量を短時間で点検し、次の前処理に迷わず進めます。
使用するデータ
以下のような辞書形式のデータをDataFrameに変換して使います。
import pandas as pd

data = {
    "名前": ["太郎", "花子", "次郎", "美香", "健一", "恵子", "翔", "茜", "隆", "葵"],
    "年齢": [23, 29, 35, 42, 18, 33, 27, 24, 31, 30],
    "職業": ["エンジニア", "デザイナー", "教師", "医師", "学生", "看護師", "プログラマー", "販売員", "弁護士", "研究者"],
    "年収(円)": [4500000, 5500000, 4900000, 7300000, 0, 4000000, 6000000, 3200000, 8000000, 5800000],
    "居住地": ["東京", "大阪", "名古屋", "札幌", "福岡", "東京", "神戸", "仙台", "横浜", "千葉"],
    "勤続年数": [2, 4, 10, 15, 1, 5, 3, 1, 12, 8]
}

df = pd.DataFrame(data)
DataFrameの出力結果:
df| 名前 | 年齢 | 職業 | 年収(円) | 居住地 | 勤続年数 | |
|---|---|---|---|---|---|---|
| 0 | 太郎 | 23 | エンジニア | 4500000 | 東京 | 2 |
| 1 | 花子 | 29 | デザイナー | 5500000 | 大阪 | 4 |
| 2 | 次郎 | 35 | 教師 | 4900000 | 名古屋 | 10 |
| 3 | 美香 | 42 | 医師 | 7300000 | 札幌 | 15 |
| 4 | 健一 | 18 | 学生 | 0 | 福岡 | 1 |
| 5 | 恵子 | 33 | 看護師 | 4000000 | 東京 | 5 |
| 6 | 翔 | 27 | プログラマー | 6000000 | 神戸 | 3 |
| 7 | 茜 | 24 | 販売員 | 3200000 | 仙台 | 1 |
| 8 | 隆 | 31 | 弁護士 | 8000000 | 横浜 | 12 |
| 9 | 葵 | 30 | 研究者 | 5800000 | 千葉 | 8 |
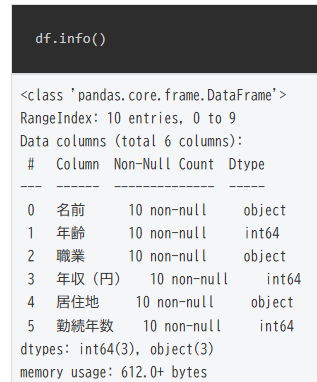
info()でデータ構造を確認
df.info()<class 'pandas.core.frame.DataFrame'> RangeIndex: 10 entries, 0 to 9 Data columns (total 6 columns): # Column Non-Null Count Dtype --- ------ -------------- ----- 0 名前 10 non-null object 1 年齢 10 non-null int64 2 職業 10 non-null object 3 年収(円) 10 non-null int64 4 居住地 10 non-null object 5 勤続年数 10 non-null int64 dtypes: int64(3), object(3) memory usage: 612.0+ bytes
この結果をもとに、①各列の型(int, object)、②欠損値の有無(non-null)、③行数・列数を確認します。ここから読み取れる内容は以下のとおりです。
-
- データ構造
- 行数:10(10entries,インデックスは 0 から 9)
- 列数: 6(total 6 columns)
- 各列のデータ型(Dtype)
- 名前(object 型):文字列(例:太郎)。
object型は、主に文字列や異なる型のデータが混在する場合に使われます。 - 年齢(int64 型) :整数 (例:25)。
int64型は、64ビットの整数値を扱います。 - 職業(object 型):文字列(例:エンジニア)
- 年収(円)(int64 型):整数(例:500 万円)
- 居住地(object 型):文字列(東京)
- 勤続年数(int64 型):整数(5 年)
- 欠損値(NaN)
各列に 10 non-null(全てのデータが埋まっている)と表示されているため、欠損値はありません。non-nullは「欠損値がない」ことを意味します。
-
- メモリ使用量
メモリ使用量は 612.0 バイトなので、小規模なデータセットです。
補足:int64 は 64 ビット整数型、object は文字列や混合型(数値や文字列の混合)を指します。
▶️ infoの公式ドキュメントも参考にしてください:
pandas DataFrame info Documentation
describe()で統計量を確認
df.describe()| 年齢 | 年収(円) | 勤続年数 | |
|---|---|---|---|
| count | 10.000000 | 1.000000e+01 | 10.000000 |
| mean | 29.200000 | 4.920000e+06 | 6.100000 |
| std | 6.762642 | 2.251321e+06 | 4.909175 |
| min | 18.000000 | 0.000000e+00 | 1.000000 |
| 25% | 24.750000 | 4.125000e+06 | 2.250000 |
| 50% | 29.500000 | 5.200000e+06 | 4.500000 |
| 75% | 32.500000 | 5.950000e+06 | 9.500000 |
| max | 42.000000 | 8.000000e+06 | 15.000000 |
describe()で得られる代表的な統計指標の意味は以下のとおりです。
- count: 欠損値以外のデータ数
- mean: 平均値
- std: 標準偏差(データのばらつき)
- min: 最小値
- 25%: 第1四分位数
- 50%: 中央値(第2四分位数)
- 75%: 第3四分位数
- max: 最大値
補足情報:describe(include=”all”) オプションでカテゴリデータも確認
describe()はデフォルトで数値データのみ出力されますが、include='all'でカテゴリデータも含めた統計が出力されます。
df.describe(include='all')| 名前 | 年齢 | 職業 | 年収(円) | 居住地 | 勤続年数 | |
|---|---|---|---|---|---|---|
| count | 10 | 10.000000 | 10 | 1.000000e+01 | 10 | 10.000000 |
| unique | 10 | NaN | 10 | NaN | 9 | NaN |
| top | 太郎 | NaN | エンジニア | NaN | 東京 | NaN |
| freq | 1 | NaN | 1 | NaN | 2 | NaN |
| mean | NaN | 29.200000 | NaN | 4.920000e+06 | NaN | 6.100000 |
| std | NaN | 6.762642 | NaN | 2.251321e+06 | NaN | 4.909175 |
| min | NaN | 18.000000 | NaN | 0.000000e+00 | NaN | 1.000000 |
| 25% | NaN | 24.750000 | NaN | 4.125000e+06 | NaN | 2.250000 |
| 50% | NaN | 29.500000 | NaN | 5.200000e+06 | NaN | 4.500000 |
| 75% | NaN | 32.500000 | NaN | 5.950000e+06 | NaN | 9.500000 |
| max | NaN | 42.000000 | NaN | 8.000000e+06 | NaN | 15.000000 |
カテゴリデータ(include=’all’)の補足
-
- unique: 異なる値の数
- top: 最も頻出する値(最頻値)
- freq: 最頻値の出現回数
- NaN: 「Not a Number(数値でない)」の略で、カテゴリデータには該当する統計量(平均や標準偏差など)がないことを示します。
補足:例えば、居住地「東京」は2回出現しているため freq=2 になります。同率最頻値(tie)が複数ある場合でも、1つだけが表示されます。
注:カテゴリデータとは、単なる文字列ではなく、決まったグループに分類できるものをいいます。例えば、「都道府県」なら「東京」「大阪」「名古屋」等、「職業」なら「エンジニア」「教師」等です。
筆者の体験談:失敗から学んだ教訓
私が初めてPandasを使ったとき、df.describe()だけを実行して「データは問題なさそうだ」と判断していました。しかし実際にはカテゴリーデータに欠損があり、モデルの学習に大きな支障が出たことがあります。
この失敗をきっかけに、まずdf.info()で欠損の有無を確認し、df.describe(include=’all’)を併用する習慣が身につきました。
失敗から得た教訓: 数値だけでは見えない情報がある。構造と統計を両方見ることが重要!
▶️ describeの公式ドキュメントも参考にしてください:
pandas DataFrame describe Documentation
まとめ
- info()で各列の型・欠損・件数を把握
- describe()で数値データの傾向を確認
- include=’all’ でカテゴリカルデータも統計化可能
- NaN = 数値でないため統計値が存在しない
統計量の用語まとめ
| 統計量 | 数値型 | カテゴリ型 |
|---|---|---|
| count | 非欠損の件数 | 非欠損の件数 |
| mean | 平均 | – |
| std | 標準偏差 | – |
| min/max | 最小・最大 | – |
| 25%/50%/75% | 四分位数 | – |
| unique | – | 異なる値の数 |
| top | – | 最頻値 |
| freq | – | 最頻値の出現数 |
次回はデータの行・列をラベル指定して抽出する方法locを解説していきます!
info()とdescribe()はどちらを先に使うべきですか?
まずは<code>info()</code>で構造(件数・型・欠損)を確認し、その後<code>describe()</code>で分布を確認する流れが扱いやすいです
describe(include=’all’)は必ず使うべきですか?
文字列列を含めて全体を把握したいときに有効です。数値列だけ見たい場合は通常の<code>describe()</code>でも十分です。
コメント